


Accreditations
Dr J. C. Stoltz
Introduction
Quality management is a challenging topic with an abundance of different views on what to do and how to do it (Knowles, 2011), and in order for companies to make sense of it all, impartial guidance is required, since Knowles (2011) warns that quality standards are for guidance purposes and not a manual on how to do things. Quality is an important subject in the modern business world (Dahlgaard, et al., 2007). Total Quality Management (TQM) and the ISO based Quality Management System (QMS) have been two of the most common approaches utilised by companies since the 1980s (Chen, et al., 2016). According to Chen, et al., (2016) empirical evidence indicates that both TQM and QMS are difficult to implement and sometimes they conflict with each other.
One of the most popular standards is the ISO 9001 Quality Management Standard, which is the focus of this research since ISO 9001 is used in over 175 countries and the number of certifications is increasing (Hallberg, et al., 2018). More than 25 years of research have been conducted on the various ISO (International Organization for Standardization) standards and their impact on organisations (Carnerud, 2018).
The purpose of ISO is strategic in nature and this is confirmed in clause 4.1 of the ISO 9001:2015 quality management system requirements, which states that the organisation shall determine external and internal matters that are relevant to its purpose and its strategic direction, and that affect its ability to achieve the intended results of its quality management system (ISO, 2015). The South African Department of Health stated that companies must provide the SAHPRA with evidence of their Quality Management System certification. This means that all IVD companies must have ISO certification.
In 2019, only 45% of IVD companies operated with ISO certification (Maseko, 2019). Implementing ISO and obtaining certification without any prior experience is not easy and it is very costly. Much resources are required and the timeline for implementation is very short; thus many organisations decide not to implement ISO certification due to various reasons (Santos, et al., 2016).
More than 25 years of research have been conducted on quality management with the main themes being implementation, performance, cost,
motivation and customer service (Carnerud, 2018). To date, no research has been performed on the IVD industry and quality and/or certification. Irrespective of the specific theme or topic being researched regarding ISO 9001 certification, the findings are generally conflicting, unclear and usually subjective. The main themes in academic articles associated with ISO 9001 certification are a motivation for ISO implementation, management involvement, customer satisfaction, financial impact and operational performance.
Little information is available on why some South African IVD companies are ISO-certified and others are not. It is also unclear what contribution ISO certification makes to the South African IVD medical device industry and customers’ perceptions regarding ISO-certified and non- certified companies. Moreover, the impact of compulsory ISO certification on the IVD industry in South Africa is also not documented. With the mandatory implementation of a Quality Management System within each IVD company, the research will critically evaluate ISO certification in the IVD Industry in South Africa. In light of the above, the problem which warrants research is the value, benefits and sustainability of the change in the quality criteria with regard to ISO certification of products in the IVD industry in South Africa. More specifically, the research will evaluate and assess various topics that include customer service, operational performance, quality of IVD products, competitive advantage and benefits obtained regarding ISO certification.
Literature Review
With the introduction of mandatory ISO certification within the IVD industry in South Africa, and added to this a specific Quality Management System for medical devices (ISO 13485:2016), the value, benefits and sustainability of the change in the quality criteria with regards to ISO certification in the IVD industry in South Africa need to be assessed. Amir et al. (2020) argue that top-level management’s awareness of ISO’s value and willingness to invest in the standard’s implementation have an impact on the standard’s ability to improve operations. Several researchers (Fonseca and Domingues, 2018; Yusliza 2019; Burki et al. 2019; Almeida et al. 2018) found that a lack of commitment from upper management hinders the implementation of new procedures. Top-level management’s support for ISO can be in the form of the company’s ability to develop quality policy and publicise it to ensure that quality objectives are propagated throughout
the organization (Latan, 2018).
The implementation of ISO can have far-reaching effects, and if top management is fully committed to quality programs, it will foster a culture of constant product improvement throughout the entire firm. Dellana et al., (2019) discovered that organizations that want ISO 9000 certification to better serve their clients’ needs report different perceived benefits from those that pursue certification to better serve their own needs. According to Latan (2018), top management commitment is critically important for registration of ISO certification in order for the company to communicate to its customers a clear commitment to quality. The extant literature indicates that top management commitment facilitates the adoption of ISO certification (Latan, 2018; Spencer et al., 2013). Therefore, drawing from the aforementioned discussion and the empirical evidence, it is hypothesised that:
Top management commitment has a significant positive effect on the adoption of ISO certification in the IVD industry in South Africa.
ISO Certification and Product Quality Performance
Adoption of ISO certificate plays a significant role in product enhancement, according to (Chen, et al., 2021). The benefits of implementing ISO certifications have been well documented in the empirical literature. Among others, these benefits include faster deliveries, better processes, higher quality products, better documentation, and less testing (Boiral et al.,2018; Sartor et al, 2019; Balzarova & Castka, 2018; Wiengarten et al, 2017; Mirtsch, 2020; Boiral and Amara, 2009).
According to del Castillo-Peces et al., (2018), the goal of implementing ISO standards is to increase the effectiveness, efficiency, and reliability of products and processes. This means that the adoption of ISO is strongly associated with enhanced product quality performance (Castillo- Peces, et al., 2018). Stamatis (2018) note that companies that are actively working to enhance their customer service, marketing, internal efficiency, and quality are more likely to implement ISO. According to research conducted by Purwanto et al. (2020), product quality performance is the single most important element influenced by the adoption and maintenance of quality standards such as those stipulated by ISO. The correlation between adoption of ISO standards and product quality enhancements have been supported empirically by studies done by (Prajogo, 2011; Fonseca, 2016; Orcos and Palomas, 2019). These findings can be buttressed by prior research findings ISO certification process and product quality enhancement found by Mhatre, et al, (2017). Based on the foregoing discussion and empirical findings, in the current study it is postulated that:
Adoption of ISO certification has a significant positive effect on the product quality performance in the IVD industry in South Africa. ISO Certification and Customer Service Satisfaction
An important element of ISO 9001 is the emphasis on customer service (ISO, 2015). According to the research of Brito et al. (2020), ISO certification can dramatically increase customer satisfaction. Furthermore, Hadidi et al. (2017), assert that adopting ISO 9001 standards enhances not just a company’s quality management systems, but also its planning, public image, products and services, decision making, competitiveness and customer service satisfaction focus (Martin, 2017; Siltori et al., 2020).
Numerous previous findings seem to indicate that there is a positive relationship between ISO implementation and customer satisfaction (Betlloch-Mas et al, 2019; Usman et al., 2019; Martin, 2017; Guo, 2020; Andry et al., 2018; Tomic & Brkic, 2018). Deducing from previous empirical evidence in the literature, it is expected in this study that the adoption of ISO certification is motivated by the company’s customer service satisfaction orientation. Thus, by adhering to the norms of ISO certification, a company can be expected to achieve a customer satisfaction focus goal by improving customer interactions and a reduction in customer complaints. Based on the above positions on the relationship between the adoption of ISO and customer service satisfaction focus, the following hypothesis is posited:
The adoption of ISO certification has a significant positive effect on the customer service satisfaction focus in the IVD industry in South Africa.
Product Quality Performance and Customer Service Satisfaction
An examination of the empirical literature seems to indicate that product quality performance has a positive impact on customer service satisfaction (Beckers et al. 2017; Rubera and Kirca 2017). It, therefore, goes to say that a company can use product quality performance as a tool to achieve its customer service satisfaction focus. This assertion
has also been supported by Febryanto and Bernarto, (2018) who found that customer satisfaction is directly correlated with product quality. In fact, the proposition of a positive effect of product quality on customer satisfaction was noted by several researchers such as (Kristiawan et al, 2021; Bernarto 2018; Suchánek, Richter, and Králová 2016; Zhong and Moon, 2020). Drawing from this discussion and a plethora of empirical evidence on the relationship between product quality and customer satisfaction, it is postulated that:
Product quality performance has a significant positive effect on the customer service satisfaction focus in the IVD industry in South Africa.
Product Quality Performance and Organisational Performance
Product quality plays a critical role in achieving a firm’s competitive advantage and affects different elements of organisational performance (Ibrahim & Daniel, 2019) since product quality performance is the primary product characteristic. Performance quality refers to the levels at which the product’s primary characteristics operate. According to Agus (2015), buyers will pay more for better performance as long as the higher price does not exceed the higher perceived value. The empirical literature further suggests that the role of product quality in enhancing organizational performance is better understood when product quality mediates the relationship between several organizational and managerial practices and organisational performance (Khan & Naeem, 2018). However, as noted by Sim et al., (2010) and Yuen et al., (2018) in the extant literature, product quality performance also directly affects organisational performance. Based on the aforementioned discussion and the empirical evidence, it may be postulated that:
Product quality performance has a significant positive effect on organisational performance in the IVD industry in South Africa.
Customer Service Satisfaction Focus and Organisational Performance
The term “customer satisfaction focus ” refers to “a pleasure resulting in the purchase of the service, including the satisfaction level below or above,” as defined by (Villagomez, 2018). The concept of organizational performance is often discussed in academic research, but there is no agreed-upon definition of organizational performance because of the variety of meanings it can take on. Bonoface (2019) found that in today’s competitive environment, traditional financial accounting measures like return on investment (ROI) can send misleading signals regarding continuous improvement and innovation, suggesting that measuring organizational performance based on financial bottom-line metrics will be misleading (Kaplan & Nortan, 1992). Thus, the balanced scorecard of Kaplan and Norton is more in line with employing customer satisfaction and economic success as measurement indicators for organizational performance.
A fundamental tenet of business is that a satisfied consumer will stick with the company and is likely to be loyal customer who repeatedly buy in the future. Thus, the more customers are satisfied, the more likely the repeat buy in the future and hence, the more profit the company realize and thus improved organisational performance (Tripathi, 2017; Farooq et al., 2018). Thus, deducing from the aforegoing argument, it can therefore be posited that:
Customer service satisfaction focus has a significant positive effect on organisational performance in the IVD industry in South Africa.
ISO Certification and Organisational Performance
Alsyouf et al. (2021) assert that ISO certification is linked to an increase in sales revenues, a drop in the value of items sold, an increase in sales revenues, and an increase in the asset turnover ratios of certified firms. According to a study by Muturi et al. (2015), ISO-certified manufacturing companies outperform non-certified companies in terms of product quality, customer satisfaction, operational, market, and financial performance. Furthermore, the empirical literature notes that, enterprises benefit from ISO certification through increased quality consciousness among employees (BSI, 2020), enhanced product and service quality (Drosos, et al., 2017), and enhanced productivity and efficiency (Magana, 2020; Noryani, 2020;Castka & Balzarova., 2018). Moreover, it is also noted in the extant literature that, adopting ISO certification gives a company a competitive advantage over rivals (Wilson & Campbell, 2018; Casado Salguero et al, 2019; Skordoulis et al, 2020).
Scholars such as Hussain, Eskildsen and Edgeman (2020) have presented evidence that ISO has a direct effect on organizational performance. In their study, the two found out that the implementation of the ISO 9001 standard led to increased customer satisfaction, staff happiness, social impact, and corporate success. Fatima et al. (2018) observed that ISO certification enhanced financial performance for large and medium-sized businesses but had little effect on small businesses. The comprehensive analysis undertaken by Nurcahyo and Habiburrahman (2021) illuminated the positive effects of the ISO standard on organisational performance. Companies in Norway and elsewhere have demonstrated that firms with ISO accreditation perform better in terms of the reduction of defective products and customer complaints, profitability, and productivity (Valmohammadi et al.,2015; Marde 2015). Based on the above-mentioned disctusion and empirical evidence in the extant literature, the current study therefore, hypothesise that:
Adoption of ISO certification has a significant positive effect on organisational performance in the IVD industry in South Africa. The postulated relationships were tested using the research methodology described below.
Research Methodology
A survey was conducted among a sample of employees of IVD companies in South Africa using the online platform, SurveyMonkey. The contact details of the in vitro diagnostics (IVD) companies in South Africa were obtained from SALDA and permission was granted by SALDA to approach them to participate in the research. The 2725 employees of the 54 South African IVD companies that are members of the South African Laboratory Diagnostic Association (SALDA) were the target population for the research (Dudovskiy, 2018). A random probability sampling technique was used to target 337 participants, in line with Scholtes et al.’s (2011) assertion that the goal of any sampling method is to extract a sample from the population to generalize the results back to the population.
Data Collection and Analysis
A questionnaire was employed consisting of two sections, the first (Section A) asked respondents to provide background information, and the second (Section B) focused on the top management commitment, adoption of ISO certification, the performance of the research participants’ products in terms of product quality, customer service satisfaction focus, and organizational performance. To measure “Top management commitment” a seven-item scale was adopted from Tzempelikos (2015), and to measure “adoption of ISO certification,” a four-item scale was adapted from Mohammed, et al., (2016). To measure “product quality performance” a four-item instrument was adopted from Tracey, et al., (2004). “Customer service satisfaction focus” was measured on a seven-item scale which was adapted from Psomas (2013). Furthermore, “Organisational performance” was measured using a four-item scale adapted from Shams-ur Rahman (2000).
All of the research items were measured on a 5- point Likert scale, with 1 standing for strongly disagree and 5 for strongly agree, to reflect the degree of agreement. To analyse the data, SPSS (Version 23) and Smart PLS statistical packages were used. Confirmatory Factor Analysis (CFA) was conducted to check for Model Fit, Reliability and Validity of the scales used in the research questionnaire. To test the validity of the scales, the shared variance was compared to the average variance extracted (AVE). Path Modeling (PM) was conducted to check for model fit, and to test the hypotheses postulated in this study.
Research Findings
A total of 262 questionnaires were completed, which implies that the response rate was over 77
%, which is quite high and acceptable for a survey.
Reliability of the measurement instrument
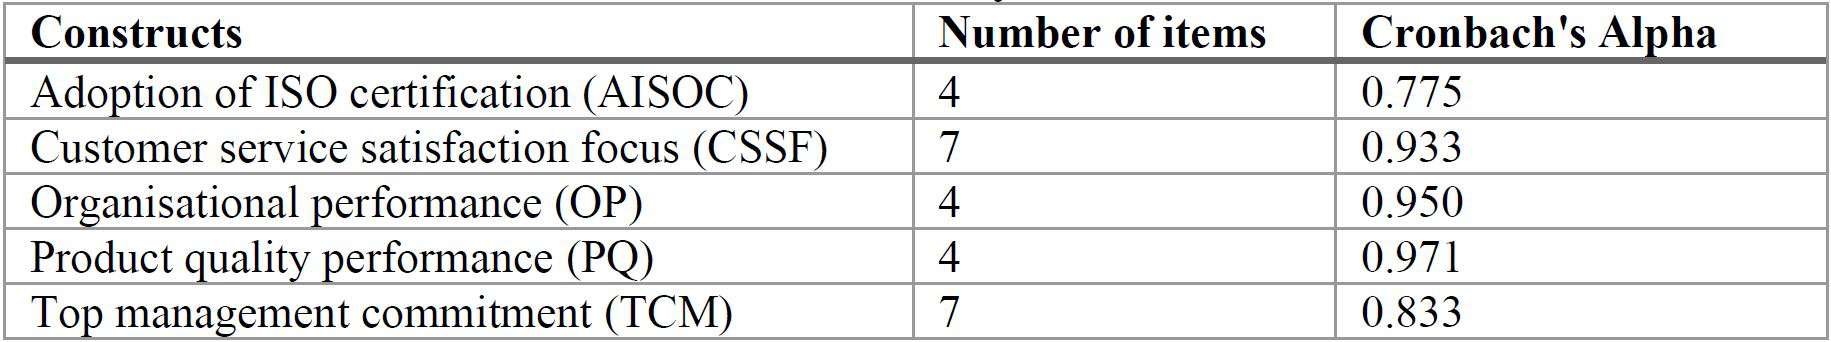
The Cronbach’s Alpha test was employed to assess the reliability of the measurement instrument and according to Babin and Zikmund (2010), the minimum acceptable level of the Cronbach’s Alpha test for the measurement is 0.70. The results in Table 1 reflect that all the constructs have a Cronbach Alpha greater than 0.70, which exceeds the minimum recommended value, thus implying that all the measurement instruments are reliable.
Table 1: Reliability Statistics
Source: Developed by the Researcher
Validity of the measurement instrument
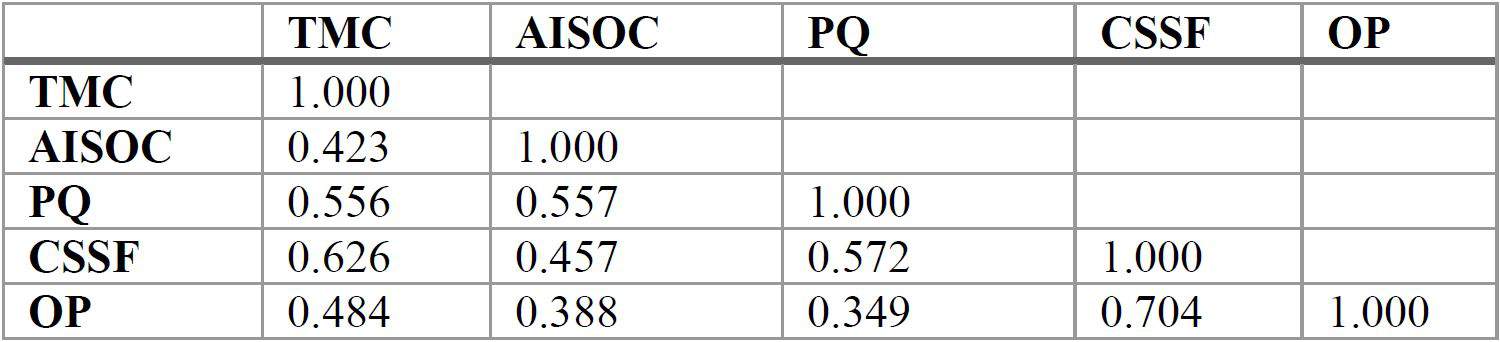
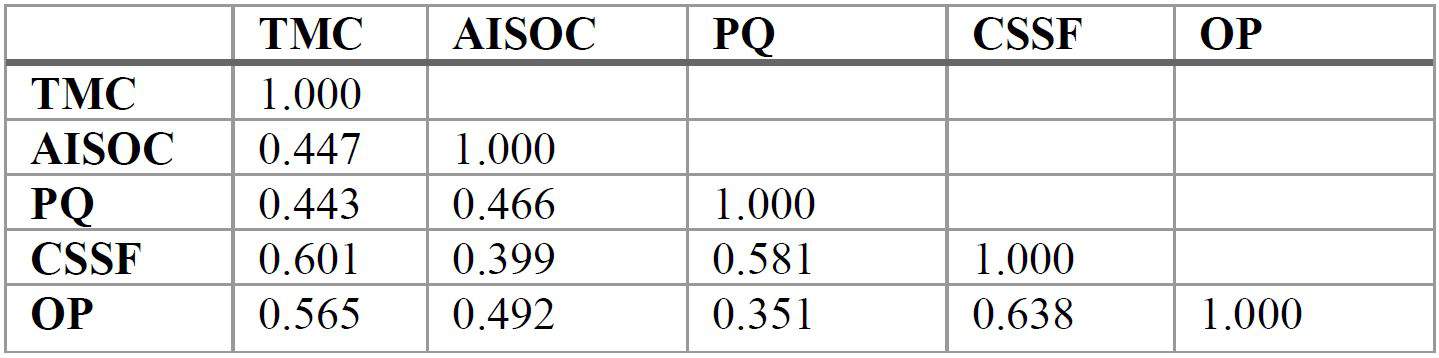
To examine the validity of the measurement instrument and detect the severity of multi- collinearity, discriminant validity was assessed by computing the bivariate correlation matrix using
Pearson’s correlation. The results of the correlation matrix which are presented in Table 2 reveal that all the construct bivariate correlation coefficients are less than 0.75, which is less than the 0.85 acceptable threshold (Sarstedt, et al., 2021). Therefore, there is sufficient evidence that the measurement instruments are valid.
Table 2: Correlation matrix
**. Correlation is significant at the 0.01 level (2-tailed).
*. Correlation is significant at the 0.05 level (2-tailed).
Structural equation modelling
Data analysis was performed using structural equation modelling (SEM), which is described as “a multivariate, statistical technique largely employed for studying relationships between latent variables (or constructs) and observed variables
that constitute a model” (Schumacker & Lomax, 2016). Confirmatory Factor Analysis (CFA) and path analysis were performed using Smart PLS simultaneously (Burton, et al., 2003).
The Smart PLS software was used in order to statistically analyse the measurement and structural models. SEM included two interconnected models: the measurement model and the structural model (Hair, et al., 2020). The measurement model, also known as confirmatory factor analysis (CFA), defines the model’s constructs (latent variables) and assigns observed variables to each, whereas the structural model, also known as regression or path analysis, defines the model’s hypothetical relationship between the latent variables (Gefen, et al., 2000). It is worth noting that a latent variable is a representation of a theoretical construct that cannot be directly observed and can have an exogenous (i.e., independent variable) or endogenous (i.e., dependent variable) form in the model (Hair, et al., 2008).
A two-step approach is recommended using SEM (Jalilvand, et al., 2017), within the first step a
measurement model is assessed by observing uni- dimensionality, reliability, validity (convergent and discriminant) of the model. In the second step, the structural model is evaluated by verifying the causal relationships based on path significance between theoretically proposed latent constructs.
Reliability and Validity
It evident from Table 3 that all Cronbach alpha values and Composite Reliability calculated using the Smart PLS meet the acceptable threshold, which implies that all the measurement instruments used in the study are deemed reliable (Zikmund, et al., 2010); (Hair, et al., 2008).
Table 3: Reliability Results using Confirmatory Factor Analysis
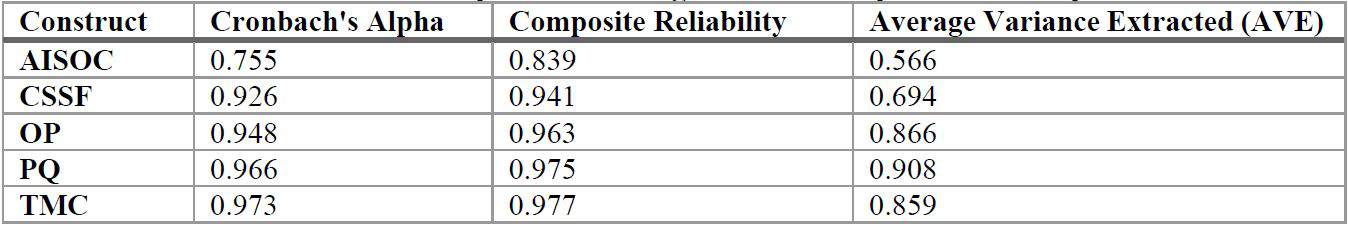
Note: AISOC= Adoption of ISO certification; CSSF= Customer service satisfaction focus; OP=Organisational performance; PQ= Product quality performance; TMC= Top management commitment
Discriminant and convergent validity were also examined using the AVE as suggested by Crego et al., (2015). According to Voorhees et al. (2016), a low correlation between variables in a conceptual model, signifies discriminant validity whilst strong loading of items on their familiar construct is an indication of convergent validity. The estimates of the factor loadings greater than 0.5 are presented in Table 4, demonstrating convergent validity.
Table 4 indicates the inter-correction values for all the variables and are less than 0.89 hence marginally confirming the existence of discriminant validity. Based on the results all the measurements meet the recommended threshold (Kline, 2016); Hair, et al., (2014).
Average Variance Extracted (AVE) is expected to
be greater than 0.5, which is the acceptable threshold (Hair, et al., 2014). Therefore, the AVE results in Table 4 reveal that they are acceptable. In the current study, the lowest AVE is 0.566 while the highest AVE is 0.908.
According to Hox, et al. (2015), discriminant validity can be assessed by comparing the AVE value to the Highest Shared Variance (HSV). An AVE that is greater than HSV indicates an existence of discriminant validity (Hair, et al., 2016). Table 4 below which reflects the discriminant validity by comparing Average Variance Extracted (AVE) and Highest Shared Variance (HSV), confirms the existence of discriminant validity.
Table 4: Construct AVE compared to HSV
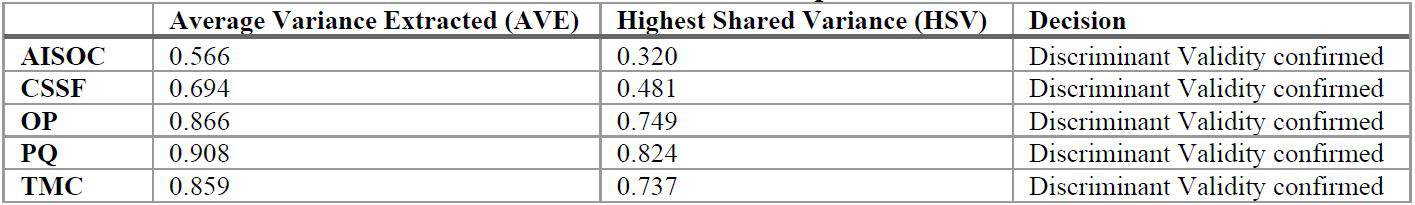
Note: AISOC= Adoption of ISO certification; CSSF= Customer service satisfaction focus; OP=Organisational performance; PQ= Product quality performance; TMC= Top management commitment
Summary of Measurement Model Assessment
Table 5 shows the descriptive statistics and item-
to-total correlation values that were generated using the SPSS statistical software and the Reliability and Validity indicators that were generated by the Smart PLS software.
Table 5: Inter-correlation values
**. Correlation is significant at the 0.01 level (2-tailed).
*. Correlation is significant at the 0.05 level (2-tailed).
The results in Table 6 indicate that all the item-to- total correlation values reached the cut-off threshold of 0.5 and therefore are acceptable. Thus, all the factor loadings for the measurement instruments were retained, thus indicating that the measurement instruments converged well on what they should measure and that they could explain at least 50% of what they were supposed to measure, hence, confirming convergent validity. The Cronbach Alpha values for all the variables confirms the existence of reliability since they are greater than 05. Furthermore, the Composite Reliability Values for all variables were above 0.6, hence confirming that all the measurement instruments used to measure the research variables are reliable.
Table 6: Scale accuracy analysis
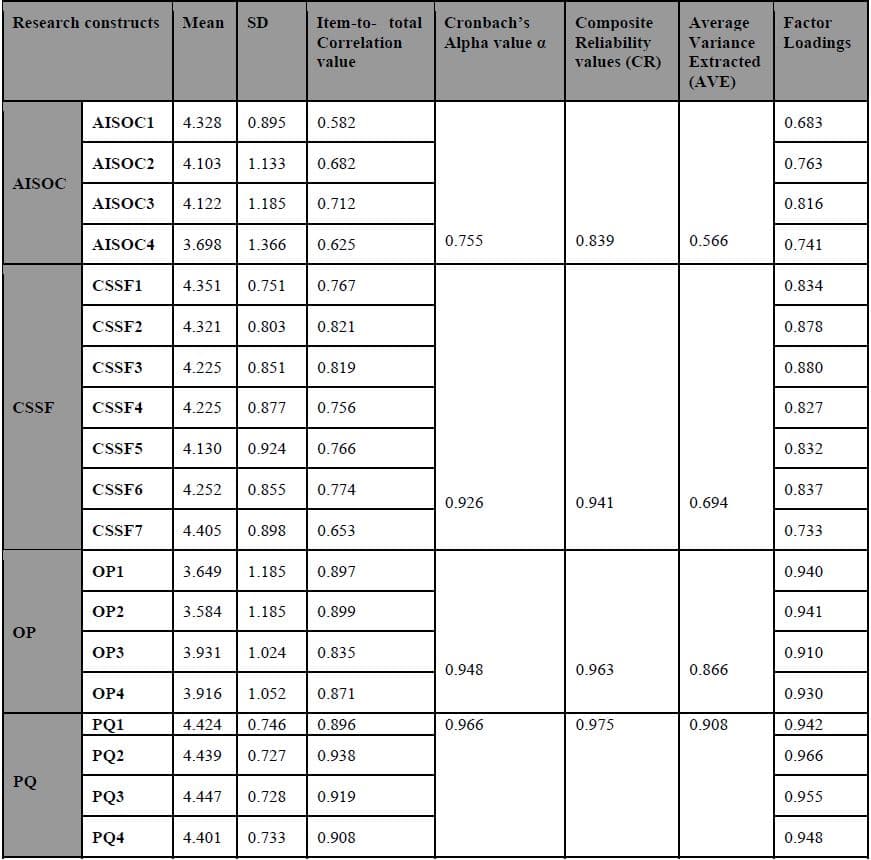
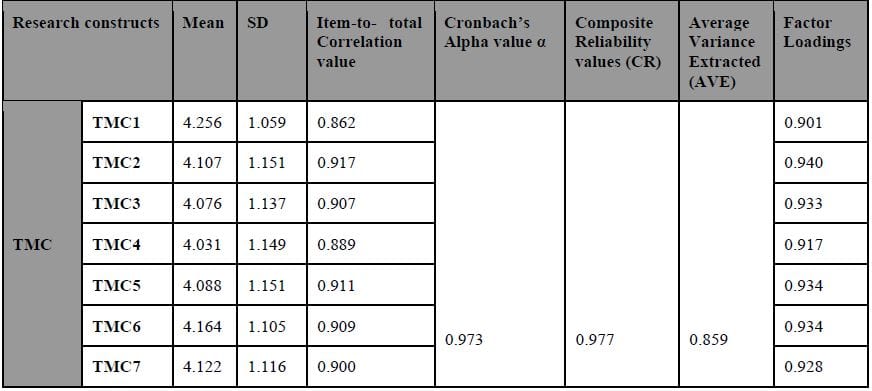
Note: SD=Standard Deviation CR=Composite Reliability AVE=Average Variance Extracted
Structural Model Assessment
After the reliability and validity were established, the next step was to assess the presumed causal linear relationships between the exogenous and endogenous latent variables. The following statistics were used to evaluate the structural model of the study using Smart PLS: coefficient of determination (R2), standardized root mean square residual (SRMR), Chi-square (x2/df), Normed Fit Index (NFI), and the root mean square error correlation (RMS-Theta).
R-square (R²), also known as the coefficient of determination, measures the model’s predictive accuracy (Hair, et al., 2016). In simple terms, R² statistics explain the variance in the endogenous variable (dependent variable) explained by the exogenous variables (independent variable). R² values range from 0 to 1, with higher values indicating higher levels of predictive accuracy (Hair, et al., 2016). However, Hair et al., (2014) suggested that scholarly research should use R² values ranging from 0.75, 0.50 and 0.25. Chin (1998) suggests R² values for endogenous latent variables of 0.67, 0.33 and 0.19 to be “substantial”, “moderate” and “weak” respectively. The R² value for, AISOC, CSSF, OP and PQ (endogenous variables) in Table 7 below indicates that the research model’s exogenous variables explain 0.325 (32,5%), 0.381(38.1%), 0.246 (24.6%) of the variance in the endogenous variable. The study’s model is thus considered to have moderate fit according to Chin’s (1998) criterion.
Table 7: R Square Statistic


The model fit was further assessed using the SRMR, Chi-square (x2/df), Normed Fit Index (NFI) and RMS Theta. The SRMR, Chi-square (x2/df), NFI and RMS Theta met the acceptable threshold and the results in Table 8 can be regarded as acceptable. For instance, A SRMR values less than 0.1 indicate a good fit (Byrne, 2006), NFI values above 0.8 indicate a good fit (Naqvi, et al., 2018), while 0.9 is regarded as satisfactory (Prabumenangh, et al., 2020), and RMS-theta values should be close to zero, whereas 0.16 should be deemed marginally acceptable indicate good model fit.
Table 8: SEM Model Fit Indexes
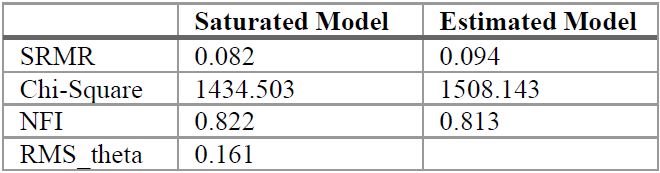
By and large, the SRMR, Chi-square, NFI and RMS Theta provided in Table 8 indicate an acceptable fit of the data to the proposed conceptual model. On the basis of the acceptable fit, after the hypothesized measurement and structural model had been assessed and finalized, the next step was to examine causal relationships among latent variables through path analysis (Henseler, et al., 2016). According to Lefcheck, (2016), SEM demonstrates that particular latent variables directly or indirectly influence other latent variables in the model, which results in estimation results that interpret how these latent variables are related.
A positive or negative relationship between two or more constructs is described as a directional hypothesis (Hair, et al., 2020). Non-directional hypotheses, on the other hand, posit a difference or a relationship but do not specify the direction of the difference or relationship (Hair, et al., 2020). For the current study, estimation results resulting from hypothesis testing are indicated in Table 9. Bootstrapping resampling method was used to test the statistical significance of the relationships.
Table 9 reflects the proposed hypotheses, pathcoefficients, t-statistics and whether a hypothesis is rejected or supported. Path coefficients are evaluated in terms of the sign (positive or negative), magnitude and significance (p-value and t- test). Literature asserts that t=1.96, p<0.05 are indicators of relationship significance and that higher path coefficients indicate strong relationships among latent variables (Kim & Park, 2017).
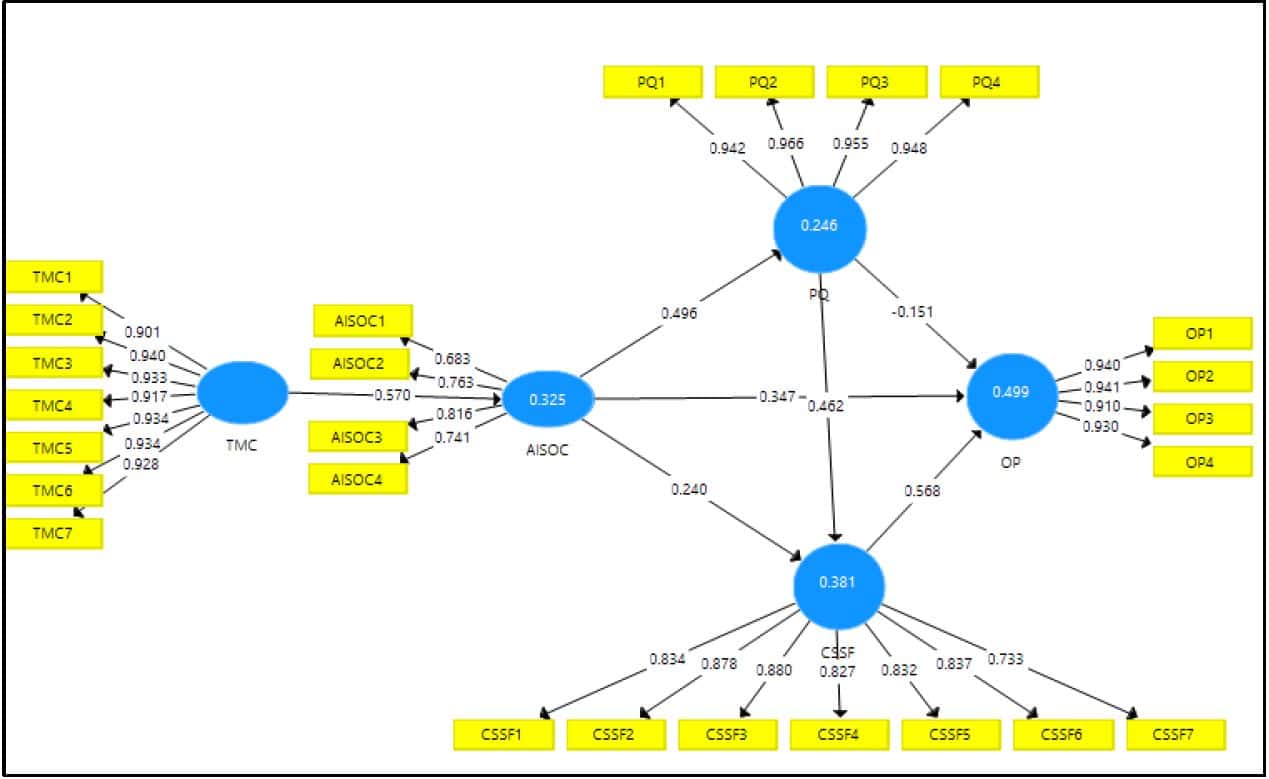
Figure 2: Structural Model
Note: AISOC=Adoption of ISO certification; CSSF=Customer service satisfaction focus; OP=Organisational performance; PQ=Product quality performance; TMC=Top management commitment
Seven hypotheses were tested, and the path coefficients are provided in Figure 2 and the hypotheses were either accepted or rejected according to the sign of the path coefficient. The significant levels were assessed using p-values and t-statistics. Respectively using the p-values, the hypotheses are viewed as significant at a 95% or higher level of significance (≥ 95%), that is to say, that the p-value is ≤ 0.05 (Di Leo & Sardanelli, 2020).
The t-statistics are expected to be greater than 1.96 for the proposed relationship to be deemed acceptable (Kartika, et al., 2017). In Table 9, the proposed hypotheses and path coefficients are provided first and followed by t-statistics and p- values which indicate the significance level of the
proposed relationship. Finally, the last column indicates s the decision on whether to accept or reject the proposed hypotheses given the research findings.
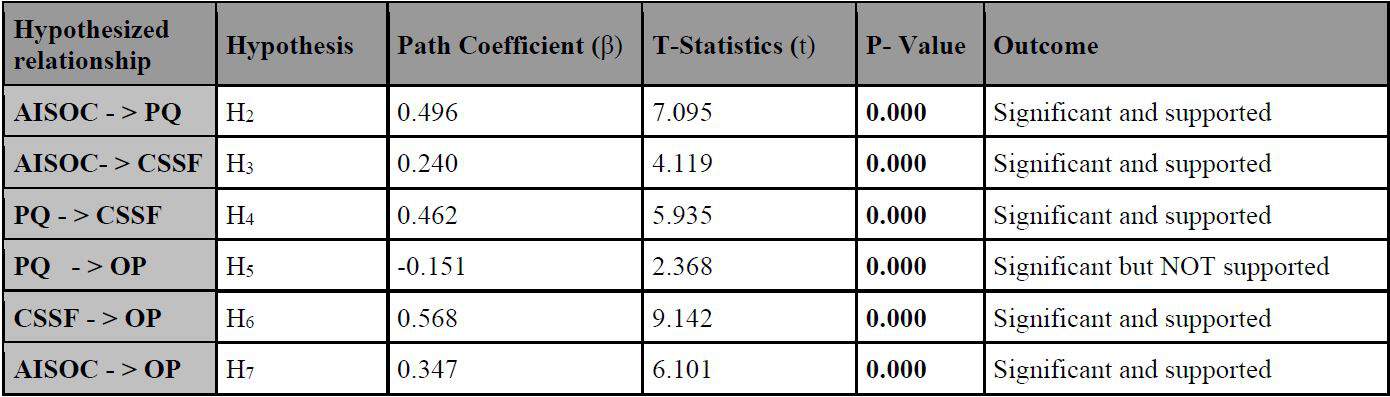
The path coefficients demonstrate whether the relationship between two constructs is negative or positive, and the strength of the relationships between the dependent and the independent variables (Johnston, et al., 2018). Upon assessing the effect of the relationship (positive or negative), the probability value also referred to as the p – value, it was demonstrated that six of the seven hypotheses were supported, and five hypotheses postulated were significant at p<0.05. Table 9 reflects the results of the seven hypotheses tested.
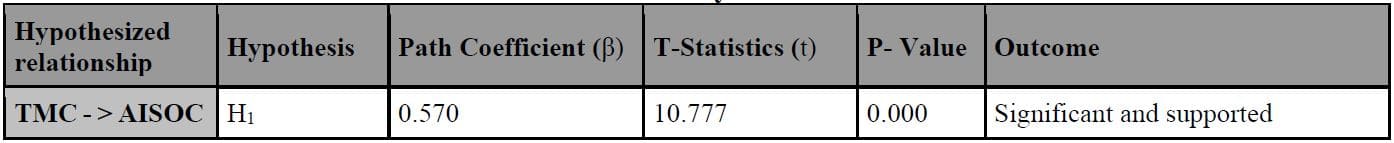
Table 9: Path Analysis Results
Note: AISOC=Adoption of ISO certification; CSSF=Customer service satisfaction focus; OP=Organisational performance; PQ=Product quality performance; TMC=Top management commitment
Discussion of the Findings
Top Management’s Commitment and Adoption of ISO Certification
The findings revealed that top management commitment has a positive association with the adoption of ISO certification (β=0.570; t=10.77; p=0.000). This finding is supported by the empirical literature. For instance, Amir et al. (2020) argue that top-level management’s awareness of ISO’s value and willingness to invest in the standard’s implementation have an impact on the standard’s ability to improve operations. Furthermore, some research findings by Fonseca and Domingues, (2018) and Yusliza (2019), also reveal that a lack of commitment from upper management hinders the implementation of new procedures. Thus, the implementation of ISO can have far-reaching effects, and if top management is fully committed to quality programs, it will foster a culture of constant product improvement throughout the entire firm (Latan, 2018).
Buttressing the same notion, according to Spencer rt al. (2013), top management commitment is critically important for registration of ISO certification in order for the company to communicate to its customers a clear commitment to quality. Besides, it is argued in the empirical literature that top managers in organisations are committed to ISO 9000 certification in order to better serve their clients’ needs through quality standards adherence and assurance (Latan, 2018; Spencer et al., 2013; Burki et al. 2019; Almeida et al. 2018; Dellana et al., 2019).
After assessing the association between the adoption of ISO certification and product quality performance, a path coefficient of β=0.496 (t=7.095, p= 0.000) was realized, which implied that adoption of ISO certification positively influences product quality performance in a significant way. The benefits of implementing ISO certifications and its positive effects on product quality are well documented in the extant literature – and thus, validating the current research finding. For example, a study by Chen, et al., (2021), indicated that the adoption of ISO certificates plays a significant role in product enhancement. Echoing the same sentiments, Castillo-Peces et al., (2018), note that the goal of implementing ISO standards is to increase the effectiveness, efficiency, and reliability of products and processes. This means that the adoption of ISO is associated with enhanced product quality performance (Castillo- Peces, et al., 2018). Moreover, Stamatis (2018) noted that companies that are actively working to enhance their customer service, marketing, internal efficiency, and quality are more likely to adopt and implement ISO certification standards.
According to research conducted by Purwanto et al., (2020), product quality performance is the single most important element influenced by the adoption and maintenance of quality standards such as those stipulated by ISO. By and large, the correlation between adoption of ISO standards and product quality enhancements have been validated by numerous previous studies (Prajogo, 2011; Mhatre, et al, 2017; Fonseca, 2016; Orcos & Palomas, 2019).
Adoption of ISO Certification and Customer Service Satisfaction Focus
In this study, adoption of ISO certification was found to be positively correlated with customer service satisfaction focus in a significant way (β=0.240; t=4.195, p= 0.000). The implication of this research finding is that customers are more satisfied with the services offered when ISO certification is adopted by companies. It is important to note that one of the ISO certification elements (ISO 9001) focuses on and emphasises customer service (ISO, 2015). Besides, empirical studies such as one by Brito et al., (2020), noted that ISO certification drastically increases customer satisfaction. Furthermore, Hadidi et al., (2017), assert that adopting ISO 9001 standards enhances not just a company’s quality management systems, but also its planning, public image, products and services, decision-making, competitiveness and customer service satisfaction focus (Martin, 2017; Siltori et al., 2020). Perhaps too, as echoed in numerous previous findings – the adoption and implementation of ISO certification are motivated by the company’s customer service satisfaction orientation (Betlloch-Mas et al, 2019; Usman et al., 2019; Martin, 2017; Guo, 2020; Andry et al., 2018; Tomic & Brkic, 2018). Thus, by adhering to the norms of ISO certification, a company can be expected to achieve a customer satisfaction focus goal by improving customer interactions and a reduction in customer complaints.
Product Quality Performance and Customer Service Satisfaction Focus
The results emanating from the current study indicate that product quality performance and customer service satisfaction are positively associated (β=0.462). This relationship is highly significant at t= 5.935, p=0.000. A cross- examination of the empirical literature seems to validate the current study finding that product quality performance has a positive impact on customer service satisfaction (Beckers et al. 2017; Rubera and Kirca 2017). It, therefore, goes to say that; a company can use product quality performance as a tool to achieve its customer service satisfaction focus. In fact, this assertion of a positive and significant relationship between product performance and customer satisfaction focus has also been supported by numerous scholars in the empirical literature such as Febryanto and Bernarto, (2018); Kristiawan et al, (2021); Ramdhani, Daryanto, and Rifin, (2015); Iskandar, Nurmalina, and Riani, (2015); Anwar and Balcioglu, (2016); Suchánek, Richter, and Králová, (2016); and Zhong and Moon, (2020).
Product Quality Performance and Organisational Performance
The results showed that there is a significant negative relationship between product quality performance and organisational performance (β=0.151; t= 2.368, p=0.018). This finding is surprising, given that even prior empirical evidence has found a positive association between product quality performance and organisational performance (Ibrahim & Daniel, 2019; Agus, 2015; Khan & Naeem, 2018; Sim et al., 2010; Yuen et al., 2018; Khan & Naeem, 2018). Given that the extant literature found that product quality performance directly affects organisational performance (Sim et al., 2010; Yuen et al., 2018), the findings are contrary to the general perspective informed by the empirical literature.
Adoption of ISO Certification and Organisational Performance
It was ascertained from this study that there is a positive relationship between the adoption of ISO certification and organisational performance as posited in the study hypothesis. The path coefficient was β=0.347 and this association was found to be significant (t= 6.101, p=0.160). This research finding is supported in the extant academic literature since Alsyouf et al. (2021) assert that ISO certification is linked to an increase in sales revenues, an increase in sales revenues, and an increase in the asset turnover ratios of certified firms. According to a study by Muturi et al. (2015), ISO-certified manufacturing companies outperform non-certified companies in terms of product quality, customer satisfaction, operational, market, and financial performance. Furthermore, the empirical literature notes that, enterprises benefit from ISO certification through increased quality consciousness among employees (BSI, 2020), enhanced product and service quality (Drosos, et al., 2017), and enhanced productivity and efficiency (Magana, 2020; Noryani, 2020; Castka & Balzarova., 2018). Moreover, it is also noted in the extant literature that, adopting ISO certification gives a company a competitive advantage over rivals (Wilson & Campbell, 2018; Casado Salguero et al, 2019; Skordoulis et al, 2020).
Scholars such as Hussain, Eskildsen and Edgeman (2020) have presented evidence that ISO has a direct effect on organizational performance after they found out that the implementation of the ISO 9001 standard led to increased customer satisfaction, staff happiness, social impact, and corporate success. Fatima et al. (2018) and Nurcahyo and Habiburrahman (2021) noted that ISO certification enhanced financial performance for large and medium-sized businesses but had little effect on small businesses.
Conclusion and Recommendations
The primary purpose of this research was to examine the role ISO certification plays within the IVD industry with regard to management involvement, the benefits of ISO certification, the value of ISO certification to product quality and services and the customer service impact.
These research findings contend that top management’s commitment has a strong positive effect on the adoption of ISO certification in the IVD industry. Furthermore, this study validates that the adoption of ISO certification has a positive and strong effect on product quality performance, customer service satisfaction focus as well as organisational performance. Interestingly to note too, is the fact that product quality performance has a strong positive effect on customer service satisfaction focus, while it has a negative but significant effect on organisational performance. The negative effect of product quality performance on organisational performance is surprising since empirical evidence seems also to support a positive relationship as postulated in this study hypothesis. However, despite the fact that product quality performance has a negative significant effect on organisational performance, it is important to note that product quality performance has stronger positive indirect effects on organisational performance via customer service satisfaction focus respectively. Finally, this research concludes that customer service satisfaction focus has a strong positive effect on organisational performance.
Based on the research findings, it is recommended that top management of companies in the IVD industry should be committed and involved with the adoption of ISO certification. In other words, top management commitment can be used as a strategic tool to influence the adoption of ISO certification, product quality performance, customer service satisfaction focus and organisational performance in the IVD industry. Furthermore, since top management’s commitment
has significant effects on the three mediators (adoption of ISO certification, product quality performance and customer service satisfaction focus), the management in the IVD industry can successfully use these mediators to amplify the effects of top management commitment on organisational performance, especially via the adoption of ISO certification and customer service satisfaction focus.
From the current study, it is also recommended that more policy interventions should be focused on encouraging companies in the IVD industry to adopt the ISO certification since this has a strong and significant effect on product quality performance, customer service satisfaction focus and organisational performance. This will comply with the ISO requirements, rules and regulations as instructed by the Government of South Africa.
References
[1]. Agus, S., Isa, M., Farid , M. & Permono, N., 2015. An assesment of SME competitiveness in Indonesia. Journal of Competitiveness, 7(2), pp. 60-74.
[2]. Almeida, D., Pradhan, N. & Muniz, J., 2018. Assessment of ISO 9001:2015 implementation factors based on AHP: Case study in Brazilian automotive sector. International Journal of Quality & Reliability Management, 35(7), pp. 1343-1359.
[3]. Alsyouf, I., Alsuwaidi, M., Hamdan, S. & Shamsuzzaman, M., 2021. Impact of ISO 55000 on organisational performance: evidence from certified UAE firms. Total Quality Management and Business Excellence, 32(6), pp. 134-152.
[4]. Amir, M., Rehman, S. A. & Khan, M. I., 2020. Mediating role of Environmental Management Accounting and Control System between top management commitment and environmental performance: a legitimacy theory. Journal of Management and Research, 7(1), pp. 132-
[5]. Andry, J. F., Suroso, J. & Bernanda, D. Y., 2018. Improving quality of smes information system solution with ISO 9126. Journal of Theoretical and Applied Information Technology, 96(14), pp. 4610-4620.
[6]. Anwar, K. & Balcioglu, H., 2016. The relationship between transformational leadership characteristics and effectiveness: A case study of construction companies in Erbil. International Journal of Science & Management, 5(2), pp. 250-256.
| in Green Supply Chains. Sustainability, | |||
| 11(4), p. 1031. | |||
| [7]. | Babin, B. & Zikmund, W., 2010. Essentials | [18]. | Burton, B. et al., 2003. A confirmatory |
| of Marketing Research. 6th ed. Boston: | factor analysis of the WMS-III in a clinical | ||
| Cengage Learning. | sample with crossvalidation in the | ||
| [8]. | Balzarova, M. & Castka, P., 2018. Social | standardization sample.. Archives of | |
| responsibility: Experts’ viewpoints on | Clinical Neuropsychology, 18(6), pp. 629- | ||
| adoption of the ISO 26000 standard. | 641. | ||
| Corporate Social Responsibility and | [19]. | Byrne, B., 2006. Structural Equation | |
| Environmental Management, 25(5), pp. | Modeling With EQS: Basic Concepts, | ||
| 819-824. | Applications, and Programming. 2nd ed. | ||
| [9]. | Beckers, S., van Doorn, J. & Verhoef, P., | New York: Routledge. | |
| 2107. Good, better, engaged? The effect of | [20]. | Carnerud, D., 2018. 25 years of quality | |
| company-initiated customer engagement | management reseach – outlines and trends. | ||
| behavior on shareholder value. Journal of the Academy of Marketing Science, 45(3), | International Journal of Quality & Reliability Management, 35(1), pp. 208- | ||
| pp. 1-18. | 231. | ||
| [10]. | Bernarto, I., 2018. The effects of service | [21]. | Casado-Salguero, G., Fernández-Gámez, |
| quality, competitive prices and product | M., Aldeanueva Fernández, I. & Ruiz- | ||
| quality on customer satisfaction. Journal of | Palomo, D., 2019. Competitive Intelligence | ||
| Environmental Management and Tourism, | and Sustainable Competitive Advantage in | ||
| 9(6), pp. 1165-1171. | the Hotel Industry. Sustainability, 11(6), p. | ||
| [11]. | Betlloch-Mas, I., Ramón-Sapena, R., | 1597. | |
| Abellán-García, C. & Pascual-Ramírez, J., | [22]. | Castillo-Peces, C., Mercado-Idoeta, C., | |
| 2019. Implementation and Operation of an | Prado-Roman, M. & Feito, C., 2018. The | ||
| Integrated Quality Management System in | influence of motivations and other factors on | ||
| Accordance With ISO 9001:2015 in a | the results of implementing ISO 9001 | ||
| Dermatology Department. Actas Dermo- | standards. European Research on | ||
| Sifiliográficas , 110(2), pp. 92-101. | Management Business Economics, 24(1), | ||
| [12]. | Boiral, O. & Amara, N., 2009. Paradoxes of | pp. 33-41. | |
| ISO 9000 Performance: a Configurational | [23]. | Castka, P. & Balzarova, M., 218. An | |
| Approach. The Quality Management | exploration of interventions in ISO 9001 and | ||
| Journal, 16(3), pp. 36-60. | ISO 14001 certification context – A multiple | ||
| [13]. | Boiral, O., Guillaumie, L., Heras- | case study approach. Journal of Cleaner | |
| Saizarbitoria, I. & Tayo Tene, C., 2018. | Production, Volume 174, pp. 1642-1652. | ||
| Adoption and Outcomes of ISO 14001: A | [24]. | Chen, C.-k., Anchecta, K., Lee, Y.-D. & | |
| Systematic Review. International Journal of | Dahlgaard, J., 2016. A stepwise ISO-based | ||
| Management Reviews, 20(2), pp. 411-432. | TQM implementation approach using ISO | ||
| [14]. | Bonoface, C., 2019. Customer satisfaction | 9001:2015. Management and Production | |
| and Organizational Performance. Muzumbe | Engineering Review, 7(4), pp. 65-75. | ||
| : Muzumbe University. | [25]. | Chen, H. et al., 2021. Implementation of | |
| [15]. | Brito, E., Pais, L., dos Santos, N. R. & | food safety management systems that meets | |
| Figueiredo, C., 2020. Knowledge | ISO 22000:2018 and HACCP: A case study | ||
| management, customer satisfaction and | of capsule biotechnology products of chaga | ||
| organizational image discriminating | mushroom. Journal of Food Science, 86(1), | ||
| certified from non-certified (ISO 9001) | pp. 40-54. | ||
| municipalities. International Journal of | [26]. | Chin, W., 1998. The partial least squares | |
| Quality & Reliability Management, 37(3), | approach for structural equation modeling. | ||
| pp. 451-469. | In: Modern methods forbusiness research . | ||
| [16]. | BSI, 2020. Integrating management systems | Mahwah: Lawrence Erlbaum Associates | |
| to improve business performance and | Publishers, pp. 295-336. | ||
| achieve competitive advantage, London: | [27]. | Crego, C., Gore, W., Rojas, S. & Widiger, | |
| BSI. | T., 2015. The discriminant (and convergent) | ||
| [17]. | Burki, U., Ersoy, P. & Najam, U., 2019. Top | validity of the Personality Inventory for | |
| Management, Green Innovations, and the | DSM–5. Personality Disorders: Theory, | ||
| Mediating Effect of Customer Cooperation | Research and Treatment, 6(4), p. 321. |
[28]. Dahlgaard, J., Kristensen, K. & Kanji, G., 2007. Fundamentals of Total Quality Management. 2nd ed. London: Taylor & Francis.
[29]. Dellana, S., Kros, J. & Rowe, W., 2019. Risk management integration and supply chain
media–based customer service and firm reputation. International Journal of Operations & Production Management.
[40]. Hadidi, L., Assaf, S., Aluwfi, K. & Akrawi, H., 2017. The effect of ISO 9001 implementation on the customer satisfaction
| performance in ISO 9001-certified and non- | of the engineering design services. | ||
| certified firms. International Journal of | International Journal of Building Pathology | ||
| Productivity and Performance Management, | and Adaptation, 35(6), pp. 176-190. | ||
| 69(6). | [41]. | Hair, J. et al., 2008. Multivariate Data | |
| [30]. | Di Leo, G. & Sardanelli, F., 2020. Statistical | Analysis. 6th ed. New Delhi: Pearson | |
| significance: p value, 0.05 threshold, and | Prentice Hall. | ||
| applications to radiomics—reasons for a | [42]. | Hair, J., Black, W., Babin, B. & Anderson, | |
| conservative approach. European Radiology | R., 2014. Mutivariate Data Analysis. 7th ed. | ||
| Experimental, 4(18), pp. 1-16. | Cambridge: Pearson. | ||
| [31]. | Drosos, D. et al., 2017. The Impact of ISO | [43]. | Hair, J., Hult, T., Ringle, T. & Sarstedt , M., |
| 9001 Quality Management System Implementation in Tourism SMEs. In: D. V. | 2016. A Primer on Partial Least Squares Structural Equation Modeling (PLS-SEM). | ||
| Katsoni, ed. Tourism, Culture and Heritage | 2nd ed. Thousand Oaks: Sage Publications. | ||
| in a Smart Economy. Greece: Springer, pp. | [44]. | Hair, J., Ortinau, D. & Harrison, D., 2020. | |
| 145-157. | Essentials of Marketing Research. 6th ed. | ||
| [32]. | Dudovskiy, J., 2018. The Ultimate Guide to | New York: McGraw-Hill Education. | |
| Writing a Dissertation in Business Studies: | [45]. | Hallberg, P., Hasche, N., Kask, J. & Öberg, | |
| A Step-by-Step Assistance. 4th ed. London: | C., 2018. Quality management systems as | ||
| Research-methodology.net. | indicators for stability and change in | ||
| [33]. | Farooq, S. et al., 2018. Impact of Service | customer-supplier relationships. IMP | |
| Quality on Customer Satisfaction in | Journal, 12(3), pp. 483-497. | ||
| Malaysia Airlines: A PLS-SEM Approach. | [46]. | Henseler, J., Hubona, G. & Ray, P., 2016. | |
| Journal of Air Transport Management, | Using PLS path modeling in new technology | ||
| Volume 67, pp. 169-180. | research: updated guidelines. Industrial | ||
| [34]. | Fatima, T., Malik, S. A. & Shabbir, A., | Management & Data Systems, 116(1), pp. 2- | |
| 2018. Hospital Healthcare Service Quality, | 20. | ||
| Patient Satisfaction and Loyalty: An | [47]. | Hox, J., de Leeuw, E. & Klausch, T., 2015. | |
| Investigation in context of Private | Mixed Mode Research: Issues in Design and | ||
| Healthcare Systems. International Journal of | Analysis. Baltimore, Wiley. | ||
| Quality & Reliability Management, 35(6), | [48]. | Hussain, T., Eskildsen, J. & Edgeman, R., | |
| pp. 1195-1214. | 2020. The intellectual structure of research | ||
| [35]. | Febryanto & Bernarto, I., 2018. The effects | in ISO 9000 standard series (1987–2015): a | |
| of service quality, competitive prices and | Bibliometric analysis. Total Quality | ||
| product quality on customer satisfaction. | Management and Business Excellence, | ||
| Journal of Environmental Management and | 31(11-12), pp. 1174-1194. | ||
| Tourism, 9(6), pp. 1165-1171. | [49]. | Ibrahim, U. A. & Daniel, C. O., 2019. | |
| [36]. | Fonseca, L., 2016. From quality gurus and | Impact of leadership on organisational | |
| TQM to ISO 9001:2015: A review of several | performance. Journal of Business, | ||
| quality paths. International Journal for | Management and Social Research, 6(2), pp. | ||
| Quality Research, 9(1), pp. 167-180. | 367-374. | ||
| [37]. | Fonseca, L. & Domingues, P., 2018. | [50]. | Iskandar, D., Nurmalina, R. & Riani, E., |
| Exploratory Research of ISO 14001:2015 | 2015. The effect of service, product quality, | ||
| Transition among Portuguese | and perceived value on customer purchase | ||
| Organizations. Sustainability, 10(3), p. 781. | intention and satisfaction. Indonesian | ||
| [38]. | Gefen, D., Straub, D. & Boudreau, M., 2000. | Journal of Business and Entrepreneurship, | |
| Structural Equation Modeling And | 1(2), pp. 51-62. | ||
| Regression: Guidelines For Research | [51]. | ISO, 2015. International Standard ISO 9001. | |
| Practice. Communications of the | Geneva: ISO 2015. | ||
| Association for Information Systems, 4(7). | [52]. | ISO, 2016. International Standard ISO | |
| [39]. | Guo, Y., Fan, D. & Zhang, X., 2020. Social | 13485. Geneva: International Organization |
for Standardization.
[53]. Jalilvand, M., Vosta, L., Mahyari, H. & Pool, J., 2017. Social responsibility influence on customer trust in hotels: mediating effects of reputation and word-of- mouth. Tourism Review, 72(1), pp. 1-14.
[54]. Johnston, R., Jones, K. & Manley, D., 2018. Confounding and collinearity in regression analysis: a cautionary tale and an alternative procedure, illustrated by studies of British voting behaviour. Quality & Quantity, Volume 52, pp. 1957-1976.
[55]. Kaplan, R. & Nortan, D., 1992. The balanced scorecard–measures that drive performance. Harvard Business Review,
S. C. & Sukdeo, N., 2020. The Implementation of ISO 9001:2015 to Improve Quality Service: A Descriptive Study on a South African Service Organization, Singapore: Conference: 2020 IEEE International Conference on Industrial Engineering and Engineering Management (IEEM),
[65]. Marde , S., Eve, A. & Tagbata, D., 2015. The Contribution of ISO 9001 to Certified Companies: Manager and Employee Perceptions. Quality Management Journal, 22(1), pp. 47-60.
[66]. Martin, A., 2017. ISO 9001 impact on operational performance. International
| 70(January-February), pp. 71-79. | Journal of Recent Advance in | ||
| [56]. | Kartika, E., Kaihatu, T., Adiwijaya, M. & | Multidisciplinary Research, 4(3), pp. 2407- | |
| Nugroho, A., 2017. Perceived supervisor | 2415. | ||
| support (PSS), affective commitment, and | [67]. | Maseko, M., 2019. ISO survey IVD Market | |
| organizational citizenship behavior (OCB): | [Interview] (5 June 2019). | ||
| study in Indonesian context, Ciputra: | [68]. | Mhatre, A. et al., 2017. Developing product | |
| Ciputra University.. | quality standards for wheelchairs used in | ||
| [57]. | Khan, B. A. & Naeem, H., 2018. Measuring | less-resourced environments. African | |
| the impact of soft and hard quality practices | Journal of Disability, 6(1), pp. 1-15. | ||
| on service innovation and organisational | [69]. | Mirtsch, M., Kinne, J. & Blind, K., 2021. | |
| performance. Total Quality Management | Exploring the Adoption of the International | ||
| and Business Excellence, 29(2), pp. 1-25. | Information Security Management System | ||
| [58]. | Kim, W. & Park, J., 2017. Examining | Standard ISO/IEC 27001: A Web Mining- | |
| Structural Relationships between Work | Based Analysis. IEEE Transactions on | ||
| Engagement, Organizational Procedural | Engineering Management, 68(1), pp. 87- | ||
| Justice, Knowledge Sharing, and Innovative | 100. | ||
| Work Behavior for Sustainable | [70]. | Mohammed, F., Ibrahim, O. & Ithnin, N., | |
| Organizations. Sustainability, 9(2), p. 205. | 2016. Factors influencing cloud computing | ||
| [59]. | Kline, R., 2016. Principles and Practice of | adoption for e-government implementation | |
| Structural Equation Modeling. 4th ed. New | in developing countries Instrument | ||
| York: The Guilfold Press. | development. Journal of systems and | ||
| [60]. | Knowles, G., 2011. Quality Management. | Information Technology, 18(3), pp. 297- | |
| 1st ed. London: Bookboon. | 327. | ||
| [61]. | Kristiawan, Y., Hartoyo, H. & Suharjo, B., | [71]. | Muturi, W. M., 2015. Determinants of |
| 2021. Customer Satisfaction: Service Quality or Product Quality (Case Study at | participation in rotating savings and credit associations in urban informal settlements: | ||
| Fast Food Restaurant in Jabodetabek). Binus | Evidence from mathare slums Nairobi, | ||
| Business Review, 12(2), pp. 165-176. | Nairobi: Jomo Kenyatta University of | ||
| [62]. | Latan, H., 2018. PLS Path Modeling in | Agriculture and Technology. | |
| Hospitality and Tourism Research: The | [72]. | Naqvi, A. et al., 2018. Development and | |
| Golden Age and Days of Future Past. In: F. | validation of a novel General Medication | ||
| Rasoolimanesh & C. Cobanoglu, eds. | Adherence Scale (GMAS) for chronic | ||
| Applying Partial Least Squares in Tourism | illness patients in Pakistan. Frontiers in | ||
| and Hospitality Research. Bingley: Emerald | Pharmacology, 9(9), p. 1124. | ||
| Publishing Limited, pp. 53-83. | [73]. | Noryani, Y. et al., 2020. Did ISO 45001, | |
| [63]. | Lefcheck, J., 2016. PIECEWISESEM: | ISO 22000, ISO 14001 and ISO 9001 | |
| Piecewise structural equation modelling in | Influence Financial Performance? Evidence | ||
| R for ecology, evolution, and systematics. | from Indonesian Industries. PalArch’s | ||
| Methods in Ecology and Evolution, 7(5), pp. | Journal of Archaeology of | ||
| 573-579. | Egypt/Egyptology, 17(7), pp. 6930-6950. | ||
| [64]. | Magana, M. H., Mikobi, B., Mukwakungu, | [74]. | Nurcahyo, R. & Habiburrahman, M., 2021. |
Relationship between ISO 9001:2015 and operational and business performance of manufacturing industries in a developing country (Indonesia). Heliyon, 7(1), p. e05537.
[75]. Orcos, R. & Palomas, S., 2019. The impact of national culture on the adoption of environmental management standards: The worldwide diffusion of ISO 14001. Cross Cultural & Strategic Management, 26(4), pp. 546-566.
[76]. Prabumenangh, A., Wibowo, A.,
Research. Munich: Springer International, pp. 587-632.
[84]. Sartor, M. et al., 2019. ISO 14001 standard: Literature review and theory-based research agenda. Quality managemnt Journal, 26(1), pp. 32-64.
[85]. Scholtes, V., Terwee, C. & Poolman, R., 2011. What makes a measurement instrument valid and reliable?. International Care Injured, 42(3), pp. 236-240.
[86]. Schumacker, R. & Lomax, R., 2016. A Beginner’s Guide to Structural Equation
| Narmaditya, B. & Prihandono, D., 2020. | Modeling. 4th ed. Mahwah: Routledge. | ||
| Determinant factors of fuel consumption | [87]. | Siltori, P. et al., 2020. Analysis of ISO 9001 | |
| behavior: Evidence from Indonesia. Utopía | certification benefits in Brazilian | ||
| y Praxis Latinoamericana, 25(7), pp. 144- | companies. Total Quality Management and | ||
| 155. | Business Excellence, 32(5), pp. 1-19. | ||
| [77]. | Prajogo, D. & McDermott, C., 2011. The | [88]. | Skordoulis, M. et al., 2020. Environmental |
| relationship between multidimensional | Innovation, Open Innovation Dynamics and | ||
| organizational culture and performance. | Competitive Advantage of Medium and | ||
| International Journal of Operations & | Large-Sized Firms. Journal of Open | ||
| Production Management, 31(7), pp. 712- | Innovation Technology Market and | ||
| 735. | Complexity, 6(4), p. 195. | ||
| [78]. | Psomas, E., Kafetzopoulos, D. & | [89]. | Spencer, Y., Adams, C. & Yapa, P. W. S., |
| Fotopoulos, C., 2013. Developing and | 2013. The mediating effects of the adoption | ||
| validating a measurement instrument of ISO | of an environmental information system on | ||
| 9001 effectiveness in food manufacturing | top management’s commitment and | ||
| SMEs. Journal of Manufacturing | environmental performance. Sustainability | ||
| Technology Management, 24(1), pp. 52-77. | Accounting, Management and Policy | ||
| [79]. | Purwanto, A., Asbari, M. & Santoso, P. B., | Journal, 4(1), pp. 75-102. | |
| 2020. Effect Of Integrated Management | [90]. | Stamatis, D., 2018. Understanding ISO 9000 | |
| System Of ISO 9001:2015 And Iso | and Implementing the Basics to Quality. 1 | ||
| 22000:2018 Implementation To Packaging | ed. s.l.:Routledge. | ||
| Industries Quality Performance In Banten. | [91]. | Suchánek, P., Richter, J. & Králová, M., | |
| Jurnal Ilmiah MEA (Manajemen, Ekonomi, | 2016. Customer Satisfaction with Quality of | ||
| [80]. | dan Akuntansi) , 4(1), pp. 17-29. Ramdhani, H. S., Daryanto, A. & Rifin, A., | Products of Food Business. Prague Economic Papers, 26(1), pp. 1-17. | |
| 2015. Kepuasan Sebagai Variabel antara | [92]. | Tomic, B. & Spasojević-Brkić, V., 2018. | |
| Kualitas Produk, Kualitas Pelayanan, dan | Customer satisfaction and ISO 9001 | ||
| Persepsi Nilai terhadap Loyalitas Konsumen | improvement requirements in the supply | ||
| pada Restoran Baru. Jurnal Ilmu Keluarga | chain. TQM Journal, 31(2), pp. 222-238. | ||
| dan Konsumen, 8(2), pp. 115-124. | [93]. | Tracey, M., Fite, R. & Sutton, M., 2004. An | |
| [81]. | Rubera, G. & Kirca, A., 2017. You gotta | Explanatory Model and Measurement | |
| serve somebody: the effects of firm | Instrument: A Guide to Supply Chain | ||
| innovation on customer satisfaction and firm | Management Research and Applications. | ||
| value. Journal of the Academy of Marketing | American Business Law Journal, 19(2), pp. | ||
| Science, 45(5), pp. 741-761. | 52-70. | ||
| [82]. | Santos, G. et al., 2016. Implementing and | [94]. | Tripathi, G., 2017. Customer Satisfaction |
| certifying ISO 14001 in Portugal: motives, | And Word Of Mouth Intentions Testing The | ||
| difficulties and benefits after ISO 9001 | Mediating Effect Of Customer Loyalty. | ||
| certification. Total Quality Management, | Journal of Service Research, 17(2). | ||
| 27(11), pp. 1211-1223. | [95]. | Tzempelikos, N., 2015. Top management | |
| [83]. | Sarstedt, M., Ringle, C. & Hair, J., 2021. | commitment and involvement and their link | |
| Partial Least Squares Structural Equation | to key account management effectiveness. | ||
| Modeling. In: C. Homburg, M. Klarmann & | Journal of Business & Industrial Marketing, | ||
| A. Vomberg, eds. Handbook of Market | 30(1), pp. 32-44. |
[96]. Usman, M. et al., 2019. Investigating the Role of QMS implementation on customers’ satisfaction: A Case Study of SMEs. IFAC- PapersOnLine, 52(13), pp. 2032-2037.
[97]. Valmohammadi, C. & Kalantari, M., 2015. The moderating effect of motivations on the relationship between obtaining ISO 9001 certification and organizational performance. The TQM Journal, 27(5), pp. 503-518.
[98]. Villagomez, J., 2018. The Department of Public Social Services’ Customer Service Center and the Focus of Performance Measures, Northridge: California State University.
[99]. Voorhees, C., Brady, M., Calantone, R. & Ramirez, E., 2015. Discriminant validity testing in marketing: an analysis, causes for concern, and proposed remedies. Journal of the Academy of Marketing Science, 44(1), pp. 1-16.
[100]. Wiengarten, F., Humphreys, P., Onofrei, G. & Fynes, B., 2017. The adoption of multiple certification standards: Perceived performance implications of quality, environmental and health & safety certifications. Production Planning and Control, 28(2), pp. 131-141.
[101]. Wilson, J. & Campbell, L., 2018. ISO 9001:2015: the evolution and convergence of quality management and knowledge management for competitive advantage. Total Quality Management and Business Excellence, 31(1), pp. 1-16.
[102]. Yuen, K., Thai, V., Wong, Y. D. & Wang, X., 2018. Interaction impacts of corporate social responsibility and service quality on shipping firms’ performance. Transportation Research Part A Policy and Practice, Volume 113, pp. 397-409.
[103]. Yusliza, M.-Y.et al., 2019. Top management commitment, corporate social responsibility and green human resource management: A Malaysian study. Benchmarking An International Journal, 26(6), pp. 2051-2078.
[104]. Zhong, Y. & Moon, H. C., 2020. What Drives Customer Satisfaction, Loyalty, and Happiness in Fast-Food Restaurants in China? Perceived Price, Service Quality, Food Quality, Physical Environment Quality, and the Moderating Role of Gender. Foods, 9(4), p. 460.
[105]. Zikmund, W., Babin, B., Carr, J. & Griffin, M., 2010. Business research methods. 8th ed. Mason: South-Western College Publications.